If you haven’t prepared your project yet, please prepare it from Basic Usage first.
Here, we will use the main components of the Logic Toolkit to display “Hello, world.”
The contents are as follows:
- Create a GameObject with a Logic Behavior component.
- Open and edit the graph in the Logic Editor window.
- Create an Action node that performs debug output (Debug.Log) to the Console.
Create a scene
If you have other scenes open, it will be confusing, so create a new scene.
- Select File > New Scene from the menu.
- In the New Scene window, select Basic (URP).
- Click the Create button
Creating a GameObject with Logic Behavior
Create a GameObject with a Logic Behavior component added to the Scene.
- Click the + button in Hierarchy.
- Select Logic Toolkit > Logic Behavior from the menu.
- Confirm the name by pressing
Enter.
About the Logic Behavior component
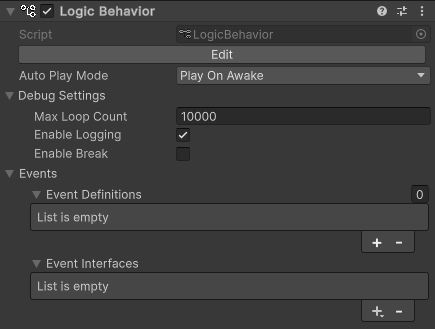
The Logic Behavior component is the main component of the Logic Toolkit.
It has a built-in node graph for controlling behavior, and it controls the behavior of GameObjects according to the contents of the edited node graph.
There are also some settings in the Inspector window, but most editing is done in the Logic Editor window, which is described below.
Opening the Logic Editor window
Graphs of Logic Behavior components are edited in the Logic Editor window.
The window is not displayed initially, so select a GameObject and click the “Edit” button in the Inspector to display it.
- Select the Logic Behavior object
- Click the Edit button on the Logic Behavior component in the Inspector window.
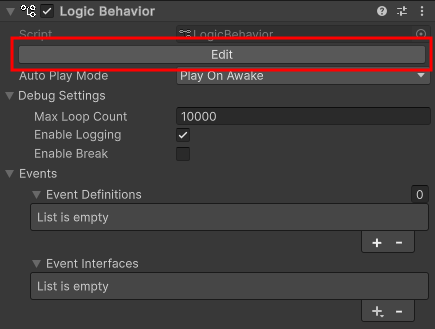
If the Logic Editor window is already displayed, the graph will switch in conjunction with selecting a GameObject in the Hierarchy window.
About the Graph View
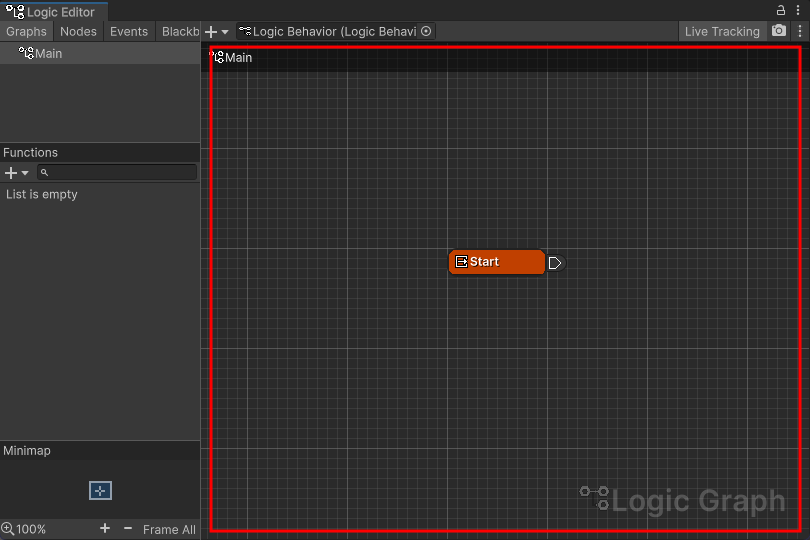
The largest pane in the Logic Editor window is the Graph View.
In this graph view, you create various nodes and connect them with wires to create behaviors.
Create Debug.Log
Let’s create a Debug.Log Action node in the Graph View.
- Click on the graph view to give it focus
- Press
Spaceto open the node creation menu - Select the Scripts tab.
- Select Actions > Debug > Debug.Log from the list.
- Confirm the node name with the
Enter key.
You can also open the node creation menu by right-clicking in the graph view and selecting Create Node.
You can find Debug.Log by typing it into the search bar in the node creation menu, but be careful to select an item that says Action as it can be used for other types of nodes as well.
About Action Nodes and ActionComponents
Let us explain the Debug.Log Action node that we created.
An Action node is a node that performs some kind of processing and immediately transitions to the next step.
The type of processing to be performed is defined in a node component called ActionComponent.
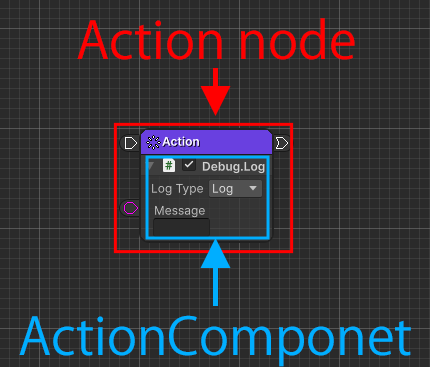
When an Action Node is executed, the processing defined in the ActionComponent will be carried out.
This time we will use the ActionComponent called Debug.Log, which outputs debug output to the Console.
There are many advantages to creating nodes and node components separately, but for now it is enough to remember that Action nodes and ActionComponents are defined separately and are executed in combination.
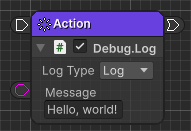
Debug.Log Settings
Enter “Hello, world!” in the Message field of Debug.Log.
- Set the Message field to
Hello, world!
Connect Debug.Log from the Start node
This time, we will connect the Start node created from the beginning to the Debug.Log Action node so that it will be executed.
- Drag the Output Execute Port of the Start node
- Drag Debug.Log to the Input Execute Port of the Action node
About the Execute Wire
The Output Execute Port of the Start node and the Input Execute Port of the Action node are connected by an Execute Wire.
This Execute Wire is a wire (connection line) used to execute the node it is connected to.
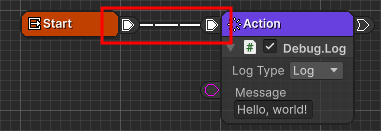
In this case, the Start node will execute the Action node of the connected Debug.Log when play begins.
Create more Debug.Logs
Let’s create another Debug.Log by dragging and dropping the transition port of the Action node with “Hello, world!” entered.
- Drag the Output Transition Port of the Debug.Log Action node.
- Drop onto an empty graph near the right side of the node
- Select the Scripts tab in the node creation menu.
- Select Actions > Debug > Debug.Log from the list.
- Confirm the node name with the
Enter key.
In this way, various nodes can also be created from the node creation menu by dragging and dropping ports.
About the Transition Wire
The Output Transition Port of the first Action node and the Input Execute Port of the second Action node are connected by a Transition Wire.
This Transition Wire is a wire (connection line) for transitioning to the destination node.

In this case, after the first Debug.Log is executed, it transitions to the second Debug.Log and two logs are output.
The difference is that Execute Wire executes the destination, while Transition Wire changes the node to be executed to the destination.
For now, it’s fine if you just remember that there are two types of wires that create the flow of execution.
Added Debug.Log settings
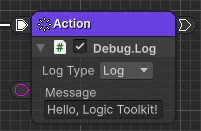
For this Debug.Log, enter “Hello, Logic Toolkit!” in the Message field.
- Set the Message field to
Hello, Logic Toolkit!
Play and check
Once you’ve done this, your graph will look like this:

Press the play button to see how it works.
- Confirm that “Hello, world!” and “Hello, Logic Toolkit!” are displayed in the Console window.
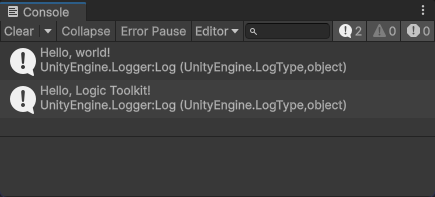
If the Console window is not visible, select Window > General > Console from the menu to display it.
As soon as an Action node performs this processing, it transitions to the next node.
If there is no next connection for the Action node, execution ends there.
Next time
Next time, we will Wait on Task node.
If you try the trial version and like it, you can purchase it from the Asset Store.
